
MinEnergi2 Infoboard
Display energy flows to the people who are using it
Share your results on energy consumption and carbon emissions in real time
A good day starts with a fresh cup of coffee and fresh figures for your energy consumption and carbon emissions. Give the work to make your buildings more energy-efficient the attention it deserves by displaying figures for the consumption of electricity, water and heating on a screen positioned prominently in the reception area, in the canteen, or next to the coffee machine. The infoboard is a unique solution that can be displayed on all screens and monitors with access to the internet and a browser.
Energy optimisation is a shared project
The work to boost energy efficiency is often the preserve of key individuals and building managers who handle the everyday operation of the buildings. However, if everyone in the organisation pulls together and focuses on energy-efficient measures, the effect can be highly visible on the bottom line. So make a game of it with competitions between separate buildings or east and west.
The infoboard is a direct channel for profiling your active input. Because it displays not only energy results, but also costs and carbon emissions. There is every reason to share your results in the field of carbon emissions in real time – all day, every day.
FUNCTION AREAS
All aboard! A unique solution that involves all your employees.
The infoboard in MinEnergi2 is our solution for making invisible energy consumption visible
and for giving energy users an active role to play in the Energy Management process.
With just a few simple, but really smart, functions.
Portal in MinEnergi2
Create and administrate an unlimited number of infoboards in MinEnergi2. The work method is simple and provides a rapid overview. EnergiData is not involved in the set-up and maintenance. It is so simple that you can adapt it yourself, deciding precisely what you want to display to employees and visitors.
Share on any screen with WiFi
The infoboard is a unique solution that can be displayed on all devices with access to the internet/a browser and with the capacity to set up an automatic infoboard.
Activate infoboards in a browser on a digital screen by entering the unique PIN code that is automatically made available for each infoboard in the portal in MinEnergi2.
Automatic infoboard
We’ve made it simple for you to set up an infoboard. There are all kinds of options, and you are free to decide exactly what you want to display. Choose our “Automatic” infoboard to display consumption of electricity, water and heating in the company as a whole.
Advanced infoboard
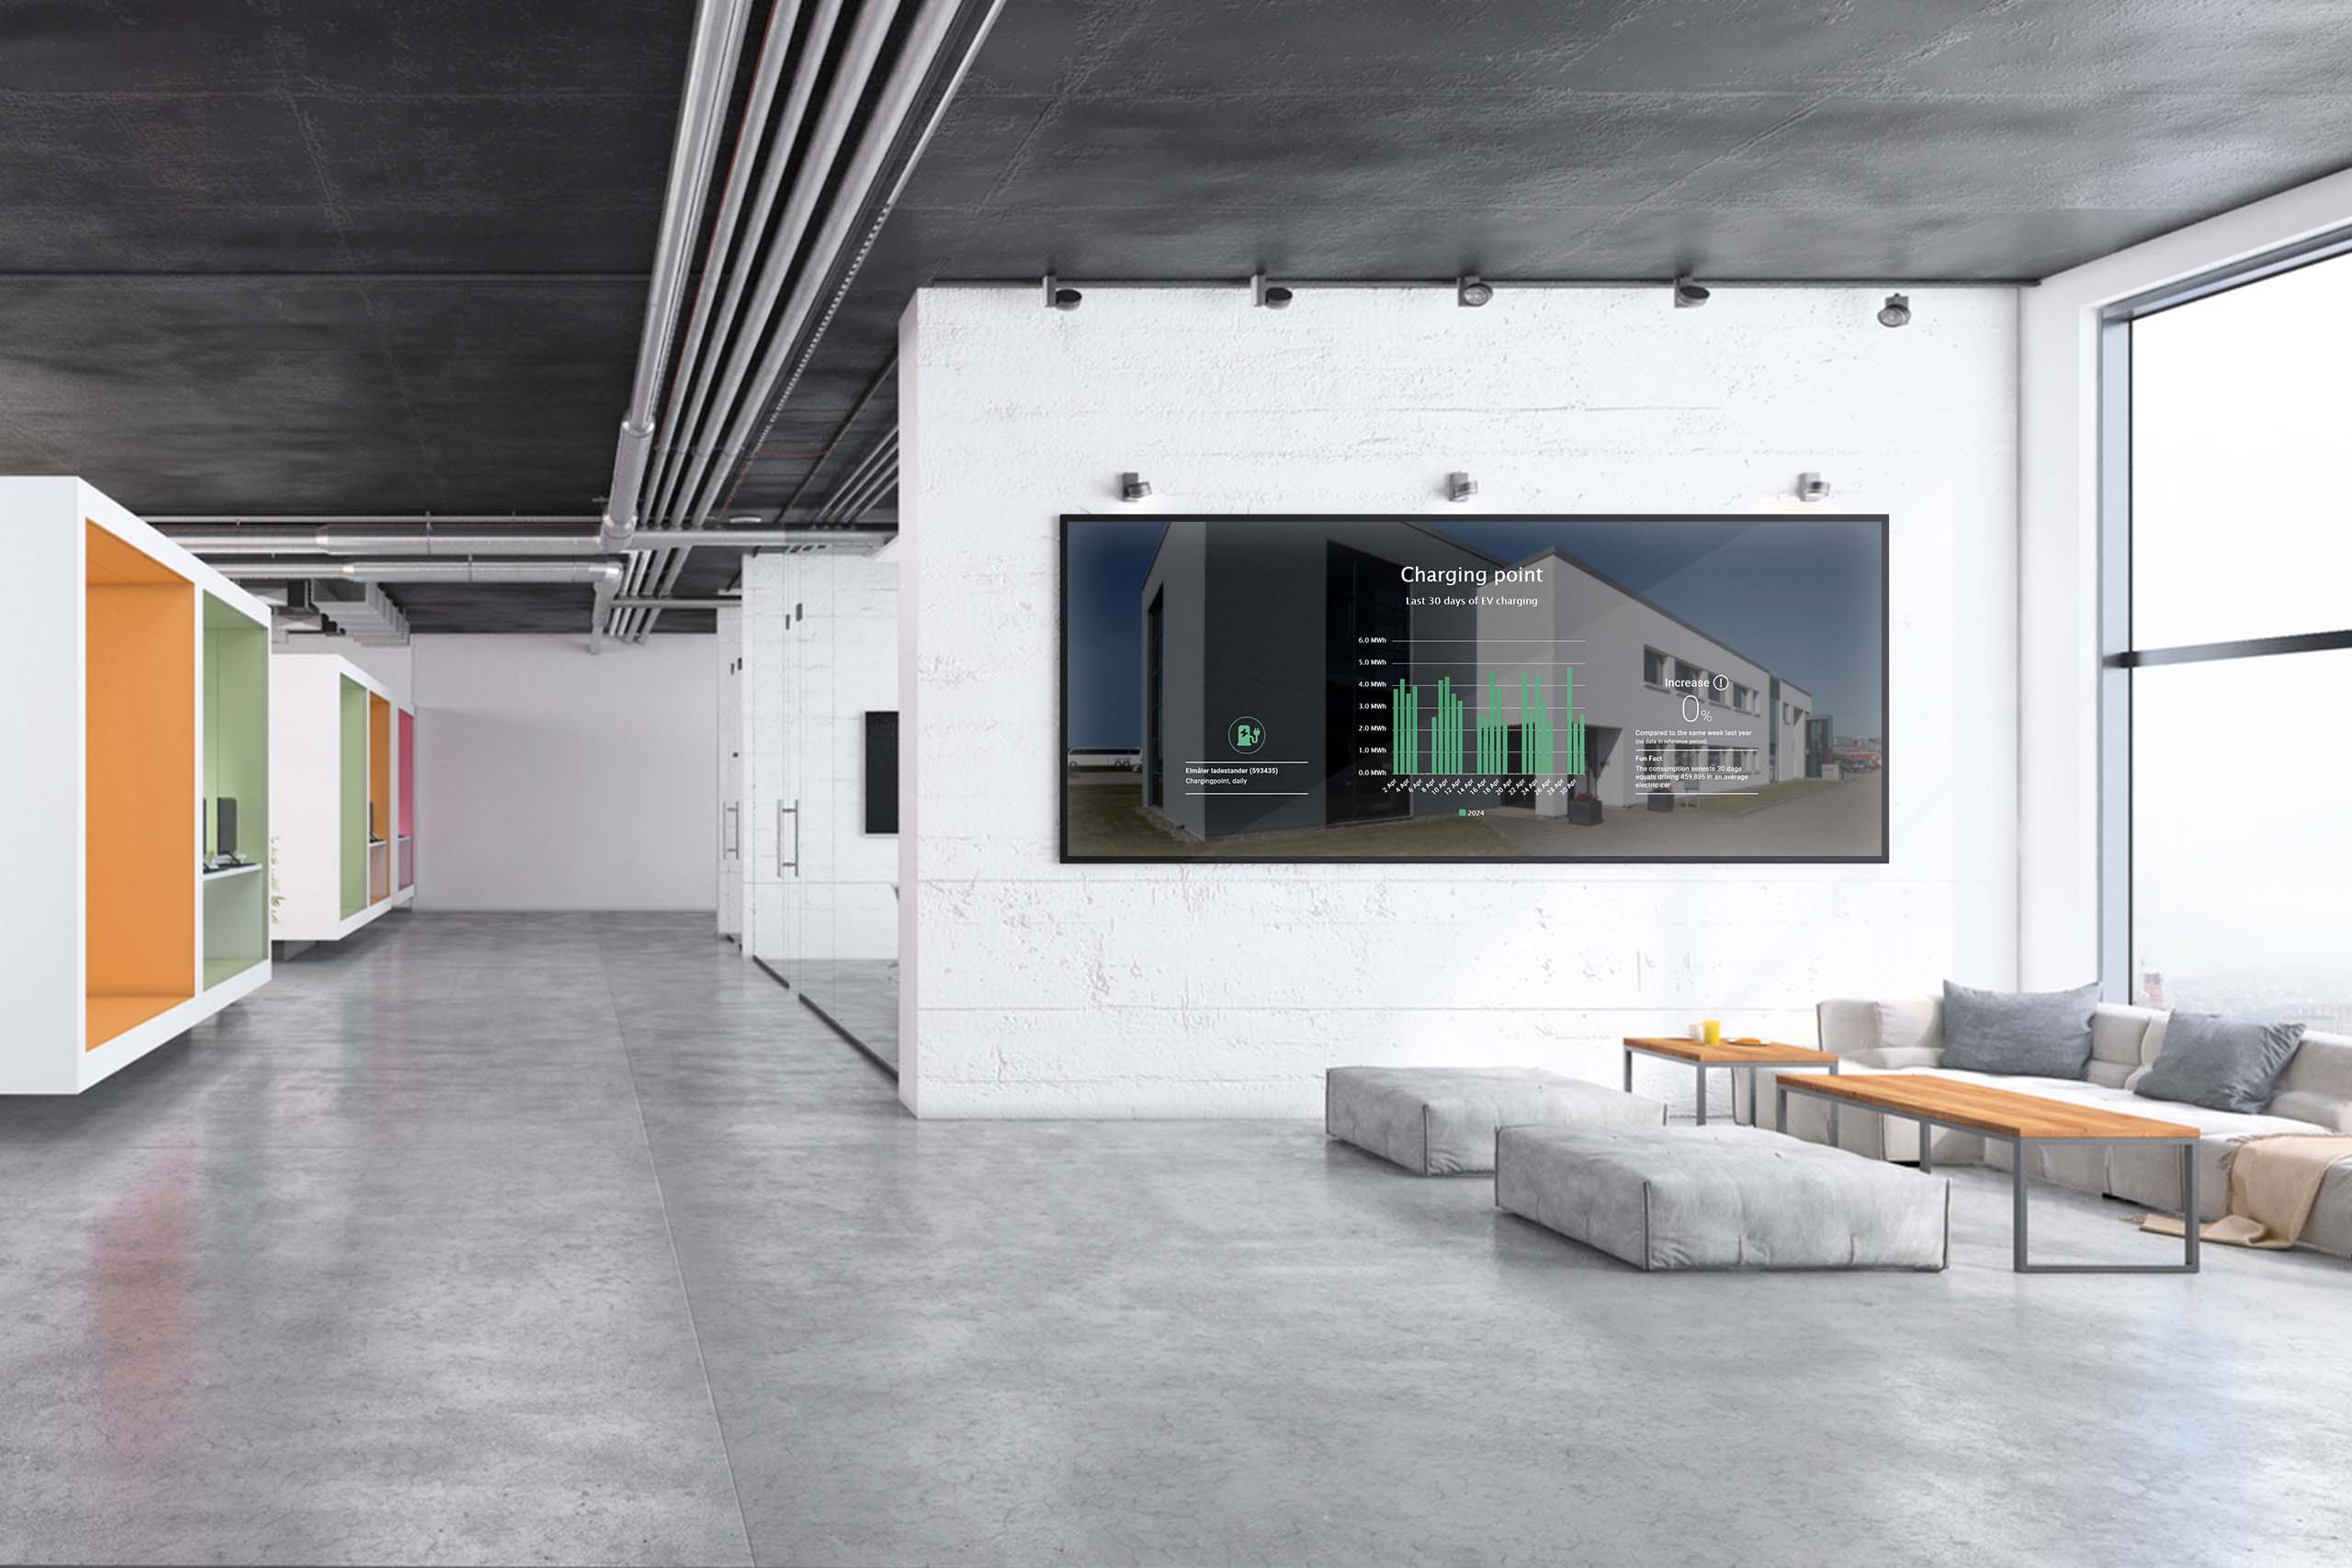
You can also set up an advanced infoboard that allows you to present precisely the data basis you wish to display. For example, this may be how much power was used over the past week to charge your electric vehicles, production from the building’s solar panels, or developments in the company’s total water consumption. In addition, you have access to a host of options for different resolutions, fun facts and comparisons.
Selected content you can choose
Name of infoboard, language, currency, measuring system and display of type of energy: electricity, water, heating, solar panels, wind, charge points or total consumption. For each type of energy, you can choose which data are to be displayed, and in which period.