

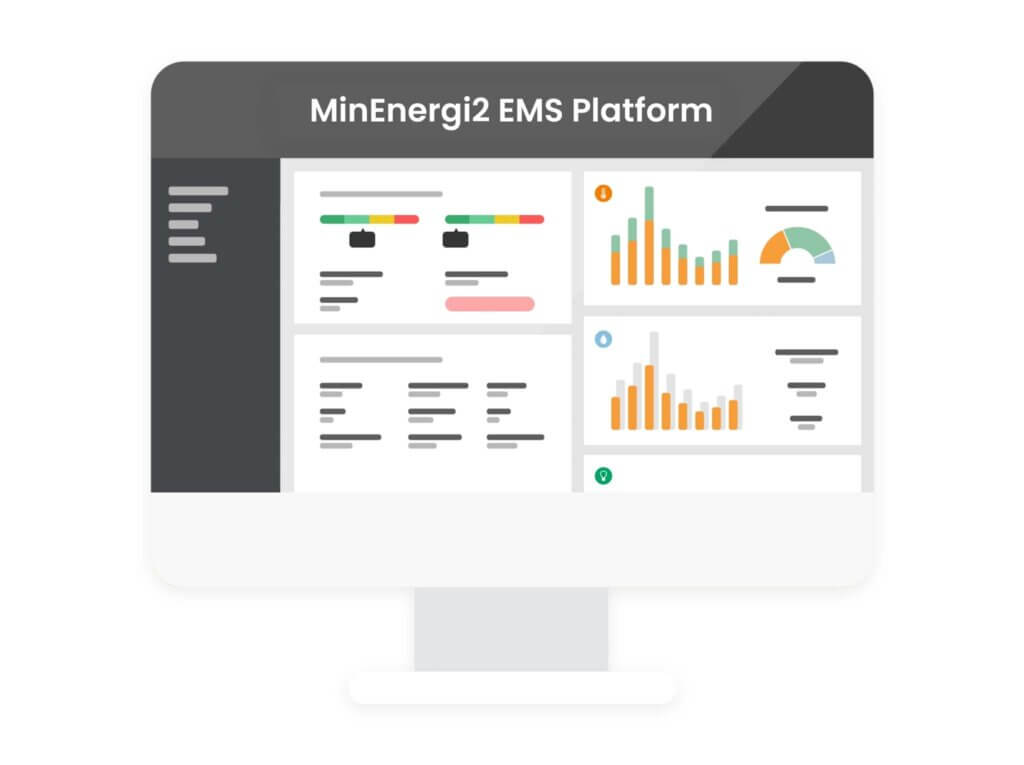
MinEnergi2 EMS Platform
Introduction to Digital Energy Management
MinEnergi2 – Energy Management System
One platform for all your energy data
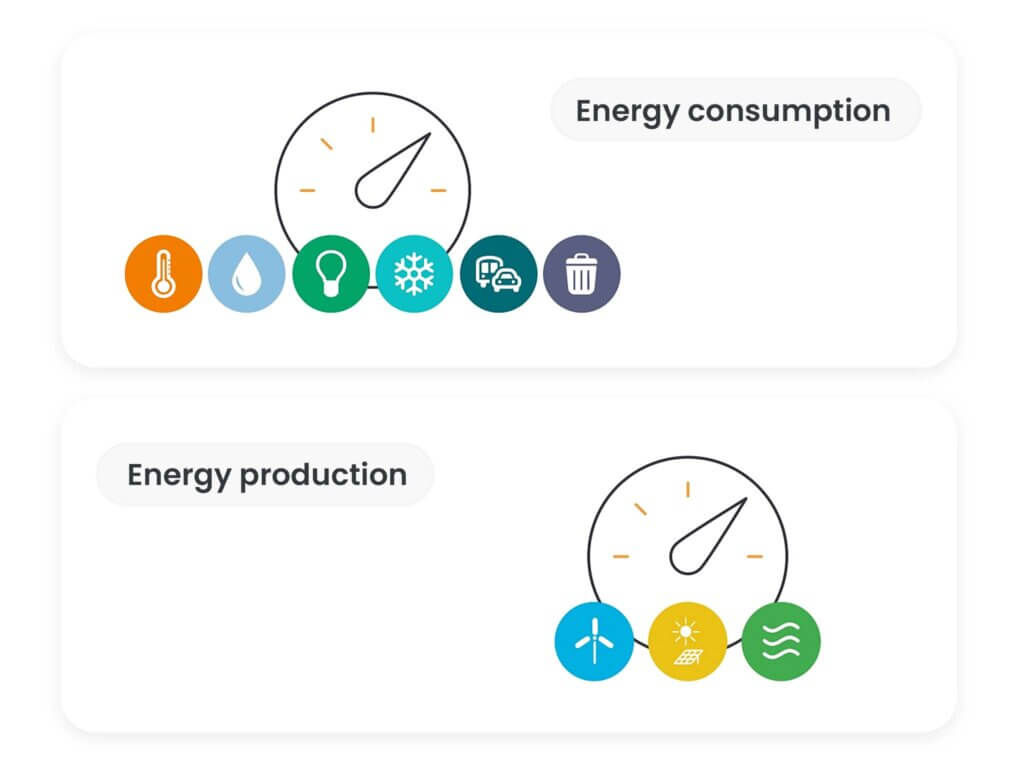
MinEnergi2 is an Energy Management System (EMS) that provides a comprehensive overview of energy and water consumption as well as CO2 emissions from buildings and other energy-consuming units across your business. Hour by hour, year by year. The more you measure, the more complete your consumption overview and your reporting options become.
Flexible and automatic data collection
We collect both consumption and production data from all types of energy meters, as well as through integrations with other systems, such as Facility Management software, Building Management Systems (BMS), Waste Management systems, and more.
We record data on 6 consumption parameters: Electricity, water, heating, cooling, transport and waste. You can thus gather all your consumption and data in one platform and at the same time get a more comprehensive reporting.
Digital energy monitoring and operational optimization
The EMS platform is the command center for your future Energy Management. Data for your energy and resource consumption is displayed in a dashboard as a quick and accurate overview of the entire company’s aggregated consumption. From here, you centrally manage the monitoring, set up tools for analysis, building benchmarking, and optimize energy consumption.
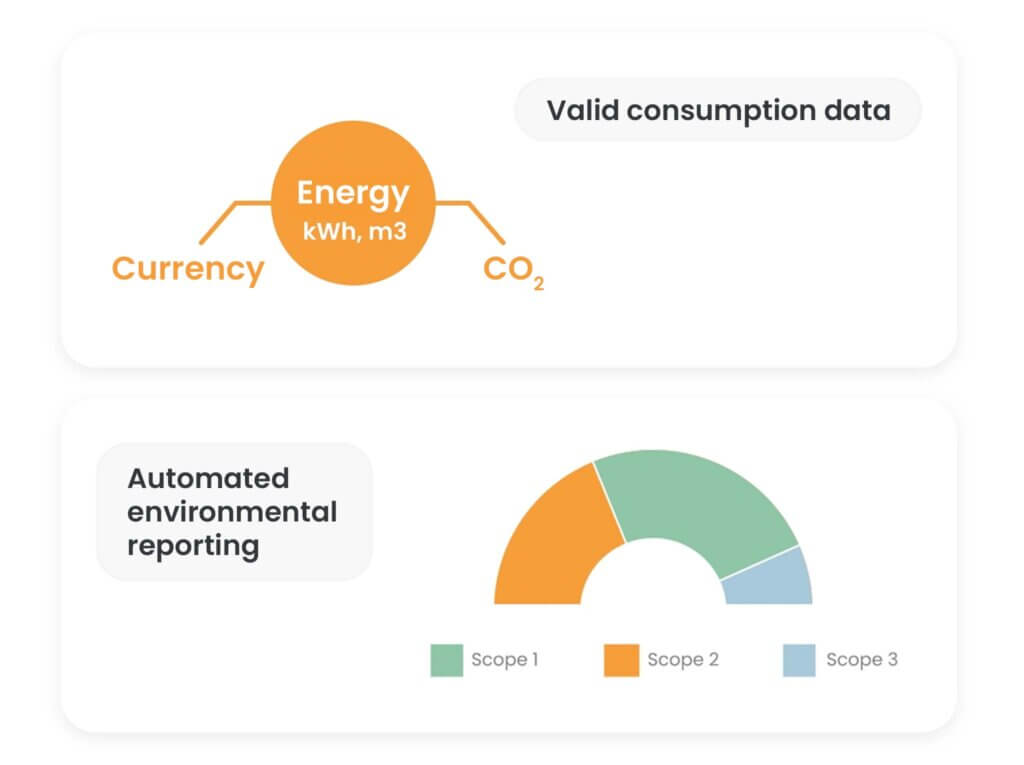
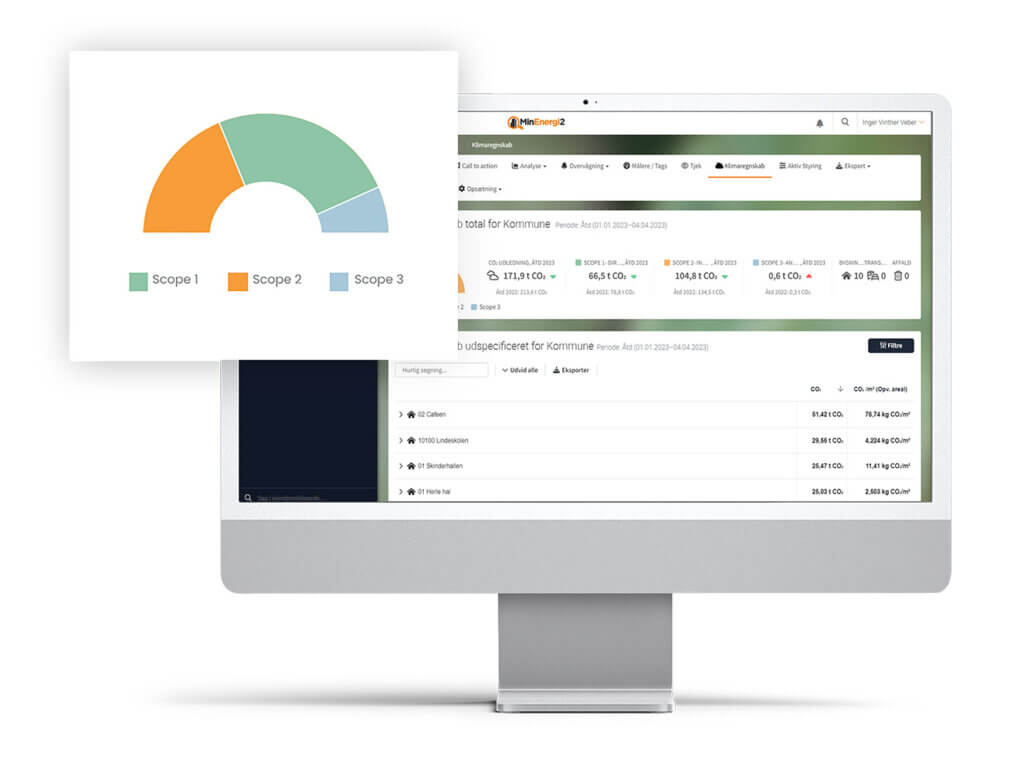
Documentation and valid consumption data for reporting
With an EMS system, you always have control over data collection and documentation in a solution tailored to your company, which automatically provides data in one overview and the data basis for your reporting. Updated, accurate, and transparent documentation – All visualized in terms of costs, CO2, and energy, for all your registered forms of energy.
Ready to share and disseminate.
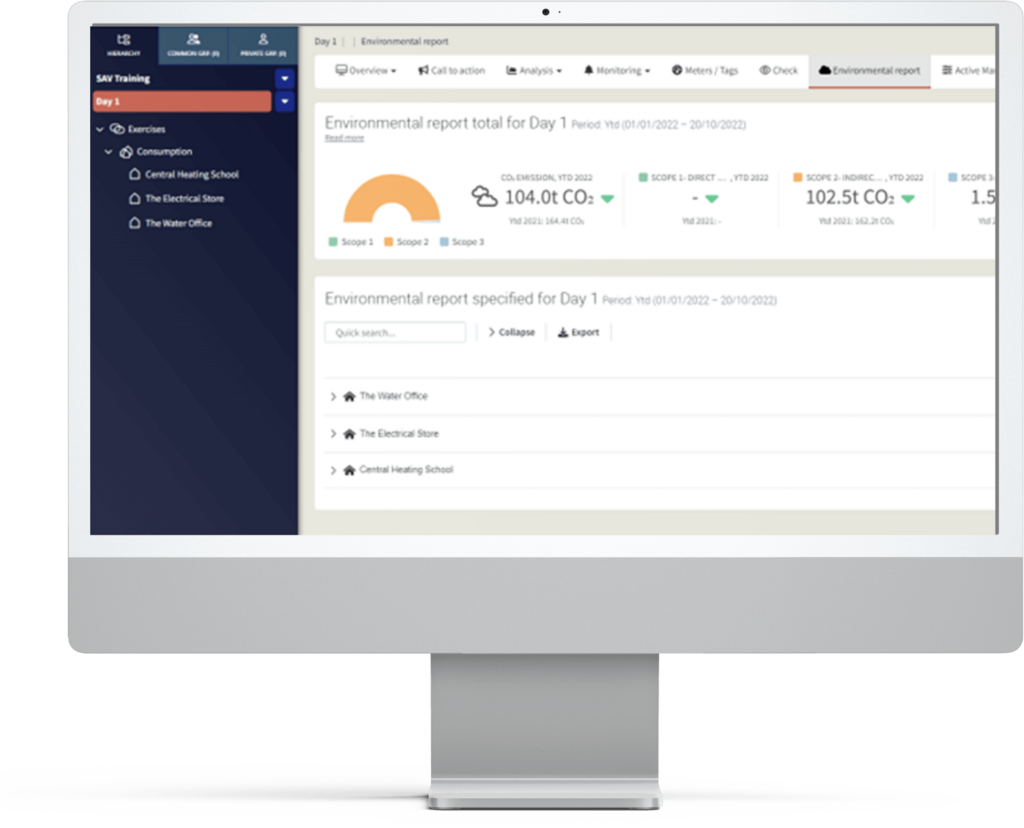
How is your climate & environmental reporting supported?
With our EMS platform for digital energy management, we simplify and automate the task of data collection and documentation for your climate accounting.
Functional areas
Everything you need for daily operations, gathered in one place.
Make energy one cohesive area that includes all your energy-related and administrative processes. Get the polished overview. Alarms and analysis tools to identify waste of energy and water resources. As well as automated budget and reporting functions for easy dissemination. Last but not least – get the positive effects of your optimization work visualized on consumption, economy, and CO2 emissions.
Dashboard & Overview
The dashboard is the first thing a user encounters when logging into MinEnergi2. It provides a quick overview of the company’s/building’s aggregated consumption, visualized in terms of costs, CO2, and energy, for all your registered forms of energy.
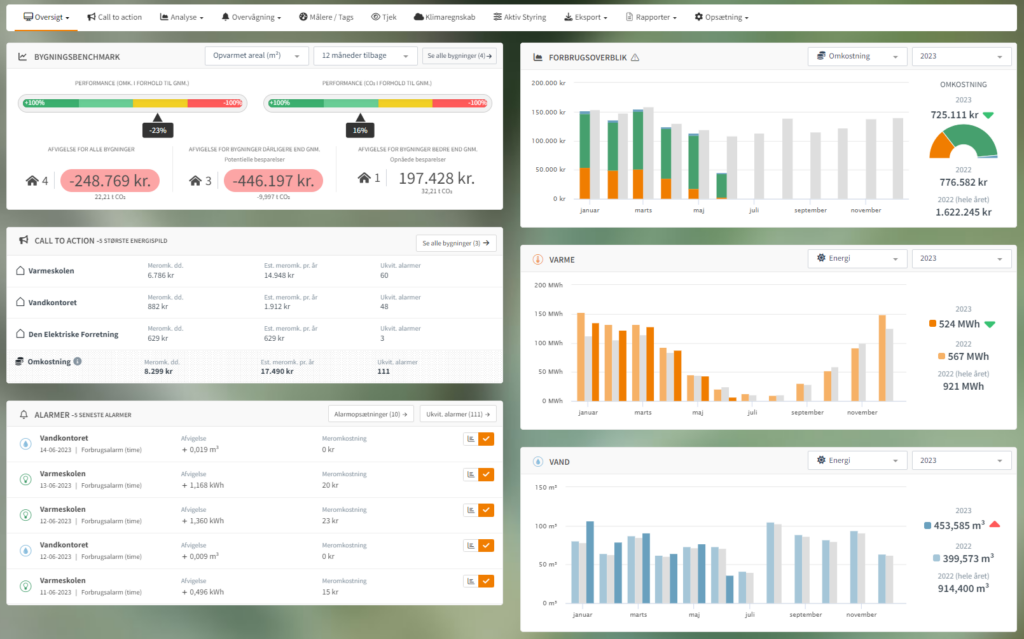
Building benchmarks
Building benchmarks compare your buildings’ consumption and performance with other similar buildings in EnergyData’s database (anonymously).
Alarms
There are two modules with alarms.
- A Call-To-Action overview, which is an economically prioritized list of unacknowledged alarms
- An overview where the five most recent unacknowledged alarms are presented, a module that shows the five latest alarms, regardless of the economic consequence.
Standby consumption
Standby consumption provides an overview of the building’s development in standby consumption over the last four weeks, as well as an indication of the distribution of consumption throughout the day.
Heatmap
Heatmap, where energy waste is localized using Heatmap, and an overview indicates how long the energy waste has been occurring.
Analysis & Benchmark
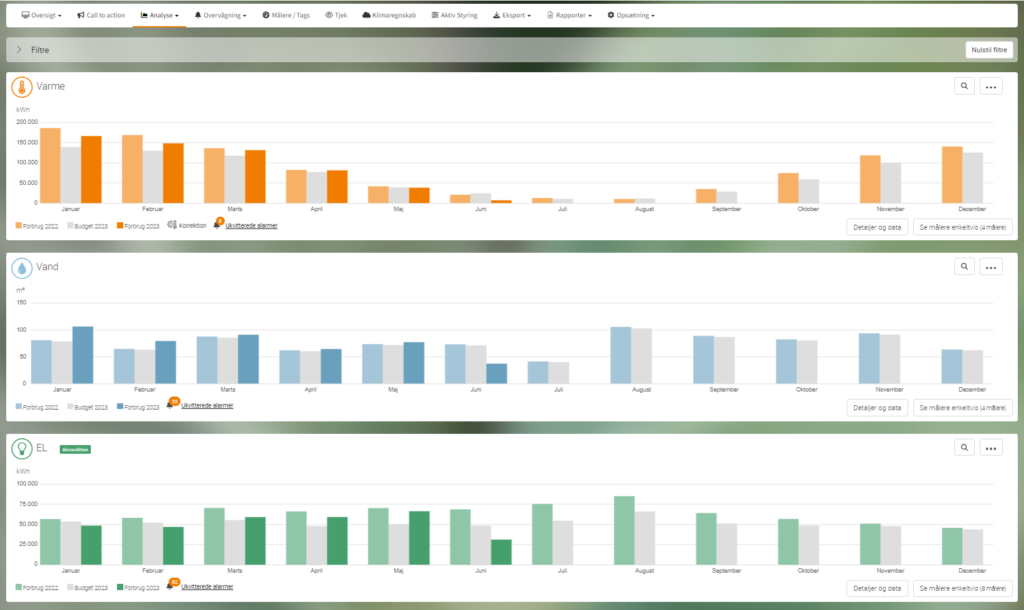
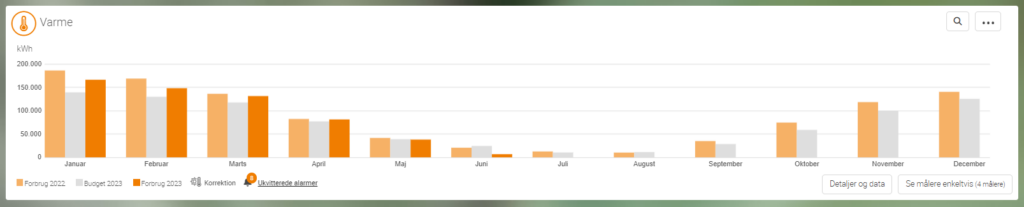
MinEnergi2 has five different analysis modules. One of the most used is the Consumption Analysis, which simply shows the current year’s energy consumption compared to the same month last year, as well as the budget for the current form of energy.
The overview can be “expanded” with one click, zooming in on the current month, and one more click shows the daily breakdown of energy consumption. Down to the aggregated energy consumption per energy type, per meter type, or for each individual meter.
Standby analysis
The standby analysis is based on the operating hours recorded in your master data, where anything outside of operating hours is considered standby consumption.
Cooling module
The cooling module conducts an analysis, down to hourly resolution, for cooling in the district heating installations. The cooling module also provides an indication of the economic consequences of any non-optimal cooling in relation to the cooling requirements that may be imposed by the district heating plant.
Key Performance Indicators (KPI) Analysis
The key performance indicators (KPI) analysis provides an overview of the company’s own buildings. The building with the highest key performance indicator is ranked at the top. The standard for MinEnergi2 is to create key performance indicators based on area distribution, but it is possible for each individual company to create other keys that are specifically tailored.
Building Benchmark
The Building Benchmark analysis compares your company’s buildings with similar buildings in MinEnergi2’s database. Anonymously shows how many buildings are being compared on the different energy forms.
Monitoring, Alarms & Call-To-Action
The monitoring modules in MinEnergi2 provide different overviews of inefficient energy consumption. All alarms set up for your company will be displayed in two different lists. The first list shows the financial implications as a consequence of exceeding the consumption limits, while the second list shows the alarms in a date prioritized order.
This makes it possible to prioritize efforts based on either the frequency of alarm occurrences or from an economic perspective.
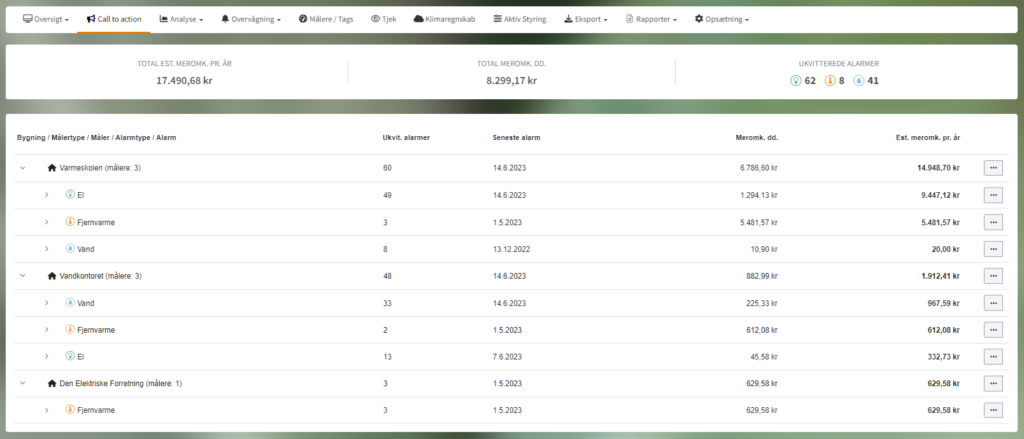
Call-To-Action list
The Call-To-Action list shows all unacknowledged alarms in an economically prioritized order, with the highest economic consequence at the top. The economic consequence is calculated from the first unacknowledged alarm on the respective energy form up to the current date. It is therefore important to acknowledge the alarms when they have been handled by the MinEnergi2 user.
Alarm List
The alarm list shows a list of all alarms that have occurred, with the most recent at the top. This list has no connection to the economic consequences but is solely based on when they were generated. In this list, it is possible to see the frequency of each set alarm, allowing prioritization if it is a frequently occurring alarm that may require action to remedy in the future.
Alarm Setup
The alarm setup is the module where alarms are created, edited, deactivated, and deleted. In addition to being able to see the frequency of each alarm, it is also possible here to see which meters are associated with an alarm, as well as possibly how many alarms are associated. The alarm setup allows you to choose from six different types of alarms, so for example, overconsumption and poor district heating cooling can be monitored.
Reporting
In MinEnergi2, you can send consumption-related reports, with different set frequencies, to relevant stakeholders in your company, or externally (board members, etc.). The reports provide an overview of the energy consumption trends over a given period.
Building Report
The building report is sent out every week, comparing the energy consumption of the past week with the week before, so the building manager can track the development and stay updated on the buildings’ energy consumption. This can be freely chosen by the users who have data access to the building.
Customized User Report
The customized user report can be sent as an instant report, showing the consumption and CO2 emissions for a previous period, or set up as a frequency report that will automatically be sent at fixed intervals in the future. The advantage of the customized user report is that it can be sent to recipients who are not necessarily users in the system, as it can provide value, for example, for a municipality to keep the municipal council informed about the development in energy consumption.
Budgets
It is possible to create budgets at all levels in MinEnergi2. In other words, you can set up budgets in the way that is most suitable for your company. The level of detail can be edited according to needs and preferences, upcoming optimization projects, etc.
This way, energy consumption can be closely monitored and compared against expectations, while also setting up budget alarms that notify if the budget is exceeded.
Service Concepts & Subscriptions
With MinEnergi2, you don’t just get an EMS platform plug & play. It comes with a service concept that complements your monitoring and data insights with our expertise and a team of energy advisors who support you in how to act on and work with your energy data.
Our service concepts are designed to provide your company with the type of Energy Management you need, now and in the future. No matter what challenges arise, our energy experts will help you meet them safely and effectively.
Download brochure
Read more about energy efficiency with MinEnergi2. To the benefit of both the budget and the climate.
Book a demo
We show you the possibilities and potentials for optimizing your energy consumption.